CS Education
What Is Churn Rate — How to Calculate It and What to Do About It
Churn rate is the percentage of customers or revenue you lose over a period. It's the most watched metric in CS — and the most misunderstood. Here's the real definition, the right way to calculate it, and what it actually tells you.

What Is Churn Rate — How to Calculate It and What to Do About It
It's the metric every CS team is measured on. Here's what it actually means — and what most teams get wrong about it.
The Definition
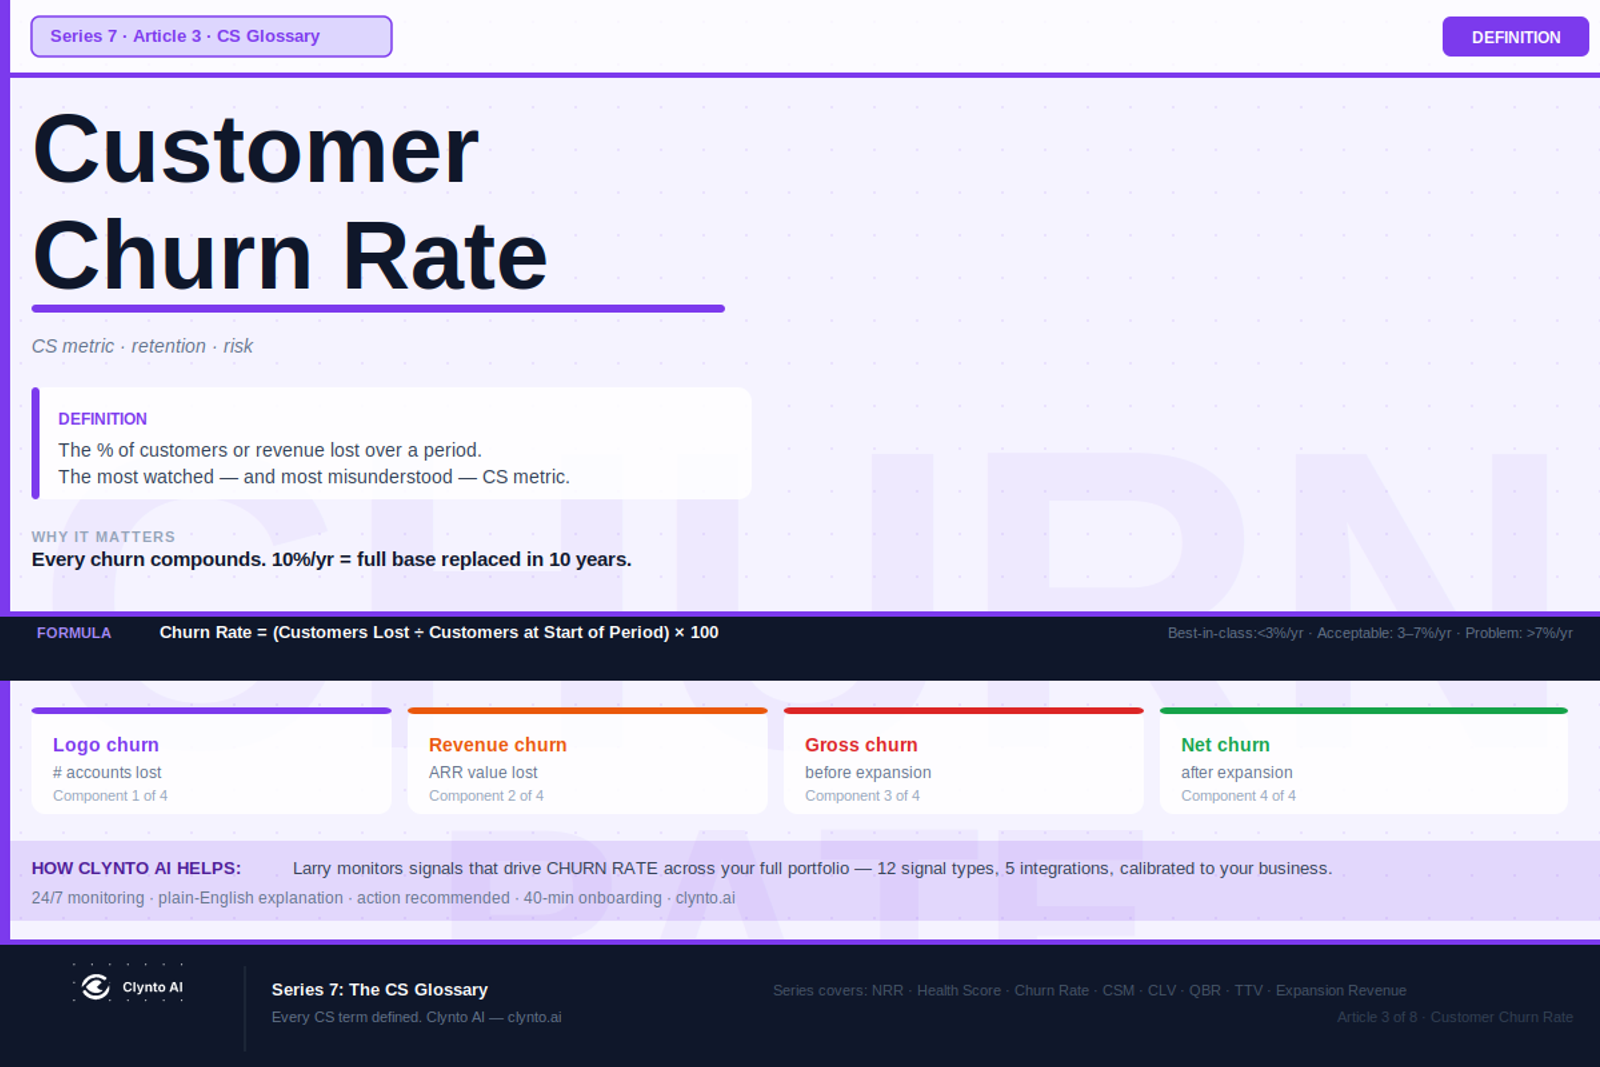
Churn rate is the percentage of customers (logo churn) or revenue (revenue churn) lost over a given time period. It measures how much of your existing base failed to renew or was lost mid-contract.
Formula: Churn Rate = (Customers Lost ÷ Customers at Start of Period) × 100
Simple. But there are four versions of churn, and confusing them is one of the most common mistakes CS leaders make when reporting up.
The Four Types of Churn
Logo churn (customer churn): The number of accounts that left. Simple count. Treats a $5k account and a $500k account identically — which is why it's a limited metric on its own.
Revenue churn: The ARR value of accounts that churned. More meaningful than logo churn for understanding business impact.
Gross revenue churn: Revenue lost from existing customers (cancellations + downgrades) before accounting for expansion. Shows the real cost of retention failure.
Net revenue churn: Gross churn minus expansion from existing customers. This is the number that directly feeds NRR. Negative net churn (expansion exceeds churn) is the gold standard.
What Good Looks Like
- Best-in-class: <3% annual logo churn
- Acceptable: 3–7% annual
- Problem signal: >7% annual
For monthly churn: divide annual benchmarks by 12. A 5% annual churn rate is roughly 0.4% monthly.
Note: these benchmarks vary significantly by segment. SMB CS teams typically see higher logo churn (smaller customers, shorter relationships) but lower revenue impact per customer. Enterprise CS teams see lower logo churn but higher ARR impact per churned account.
What Drives Churn — And What CS Can Control
CS can prevent: Slow drift, silent champion syndrome, unresolved product friction, missed expansion signals, poor onboarding, lack of proactive engagement.
CS often cannot prevent: Budget cuts, company acquisition, product-market fit failure, competitive displacement on price.
The most important insight in churn analysis is this distinction. CS teams that measure total churn without separating preventable from structural churn are measuring the wrong thing — and optimising against the wrong target.
How Clynto AI Reduces Preventable Churn
Larry monitors 8 churn risk conditions across every account daily — evaluating combinations that no single rule catches: usage decline + champion silence + renewal proximity, support spike + engagement drop + billing contact change, and more.
Every signal Larry detects gets a severity score (Low/Medium/High/Critical) and a plain-English root-cause explanation. Your CSMs know not just that an account is at risk — but specifically why, what changed, and what to lead with when they reach out.
The result: preventable churn caught earlier, saved more consistently, without requiring your CSMs to manually triage 80 accounts every Monday morning.
Clynto AI is currently in pre-launch.
[Get demo → clynto.ai]
Lucas Bennett
Clynto AI
Customer Success practitioner with over 10 years building CS teams from scratch across US, Canada, Singapore as a CSM, team lead, CS leader, and consultant.
Book 20 min with Lucas