Customer Success Leadership
The CS Metrics That Actually Predict Churn (And the Ones That Don't)
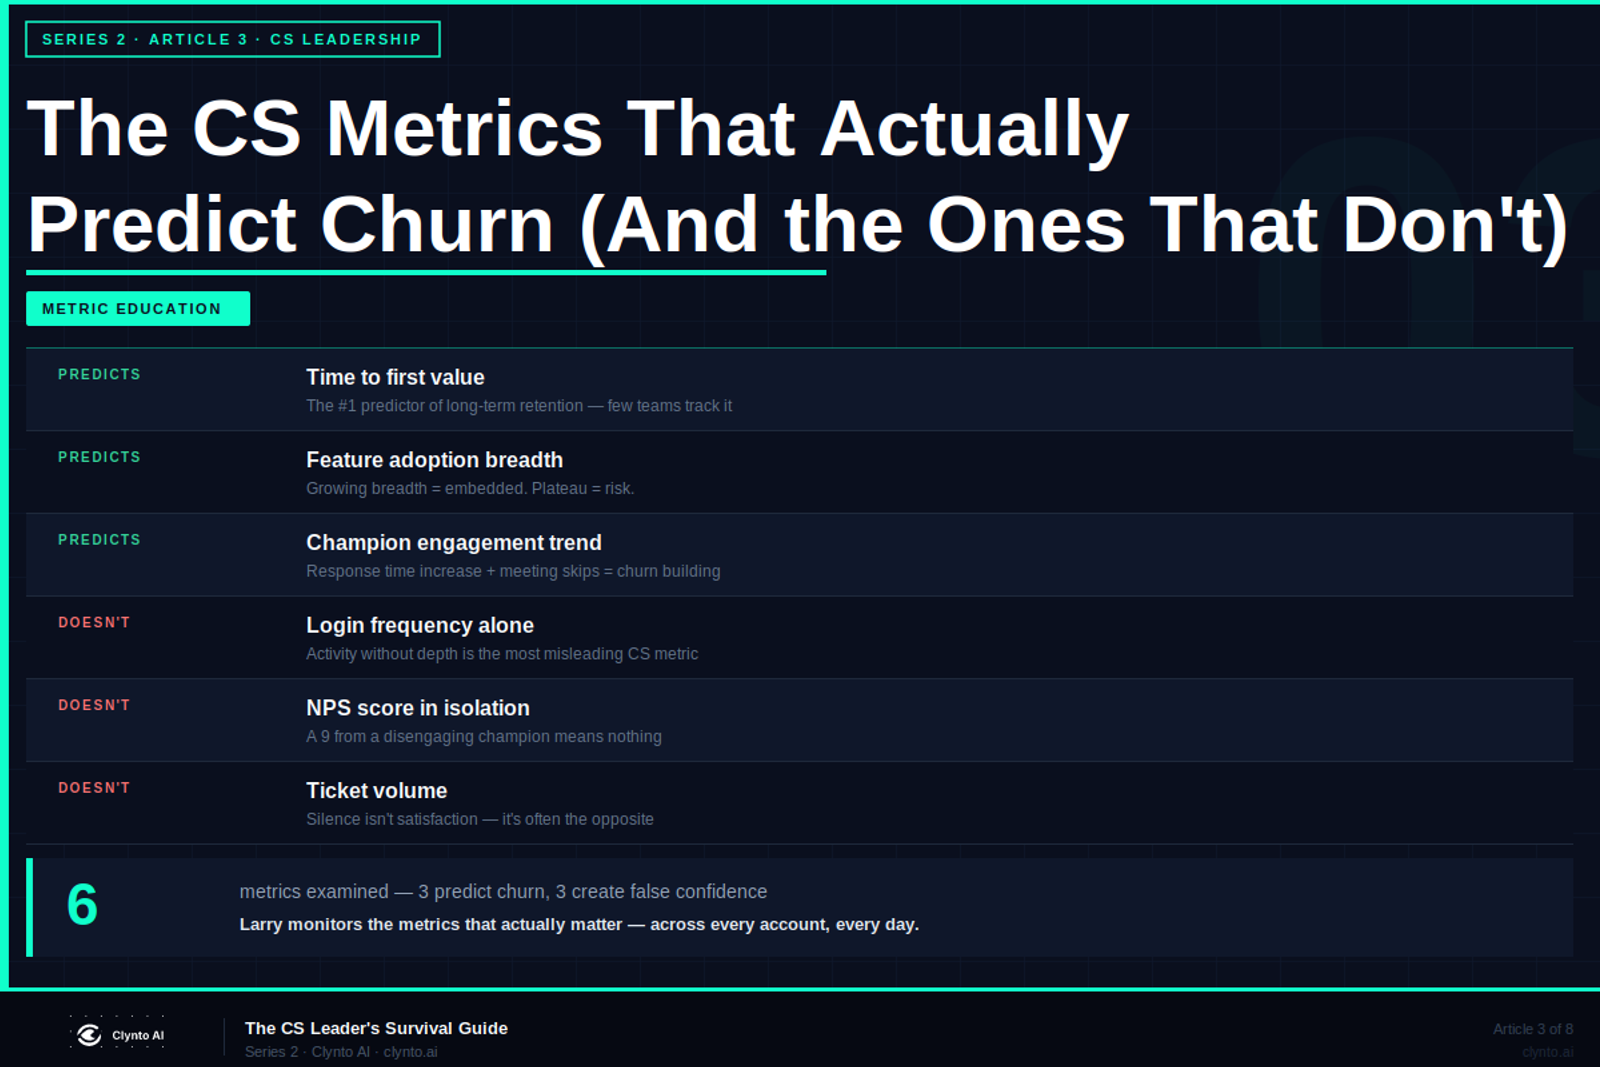
Not every CS metric predicts churn. Some create false confidence. Here's the honest breakdown - 3 metrics that actually forecast churn risk and 3 that actively mislead CS leaders.

The CS Metrics That Actually Predict Churn (And the Ones That Don't)
Some CS metrics tell you the future. Others confirm what you already knew. And a few actively mislead you. Here's which is which.
Why This Distinction Matters
CS teams measure a lot. Health scores, NPS, CSAT, login frequency, ticket volume, ARR per account, days since last contact. The problem isn't a shortage of data. It's knowing which data actually predicts what's coming - and which data creates a false sense of control.
The metrics that predict churn are almost always leading indicators: they tell you what's building before it surfaces as a problem. The metrics that don't predict churn are almost always lagging or activity-based: they tell you what happened or how active an account is, not whether that activity is producing value.
Here's the breakdown.
Metrics That Actually Predict Churn
1. Time to First Value (TTV)
The single strongest predictor of long-term retention across B2B SaaS. Customers who reach their first meaningful product outcome quickly stay significantly longer than customers who don't — regardless of deal size, industry, or product complexity.
The reason is psychological as much as functional: a customer who experiences value in the first week has evidence that the product works. A customer who is still waiting for value at week four is already reconsidering the decision.
Most CS teams don't track TTV explicitly. They track onboarding completion (a different thing) or go-live date (a different thing). TTV requires defining what "first value moment" means for each customer segment - and measuring the time to it precisely.
Larry tracks adoption milestones from Mixpanel and flags accounts where TTV is extending beyond your segment's benchmark.
2. Feature Adoption Breadth
An account that uses one or two features at surface level is vulnerable. An account that has embedded your product across multiple workflows, features, and team members is not.
The best predictor within feature adoption is the trend, not the absolute number. A growing adoption breadth - more features activated, more users engaged, deeper integration into workflow - is a retention signal. A plateau or decline in adoption breadth is a churn signal, even when total usage looks stable.
Larry monitors feature breadth against workspace median and flags accounts where adoption has plateaued for 4+ weeks.
3. Champion Engagement Trend
Not whether the champion is engaged - but whether their engagement is increasing, stable, or declining. A champion who was replying in 4 hours and is now taking 48 hours isn't necessarily disengaged yet. But the trend is telling you something important before it becomes obvious.
Combined with other signals - QBR attendance, NPS submission, meeting agenda participation - the champion engagement trend is one of the most reliable 60–90 day leading indicators of churn in CS.
Metrics That Create False Confidence
1. Login Frequency (Alone)
Login frequency is one of the most commonly cited health metrics in CS platforms - and one of the most misleading when read in isolation.
A customer who logs in daily but uses only one shallow feature is not healthy. They're habituated. Habit churns at renewal when someone asks whether the bill is justified. Activity is not the same as value. Measuring one as a proxy for the other is where health scores go wrong.
2. NPS Score (In Isolation)
A 9 from a champion who is progressively less engaged is not the same as a 9 from a champion who is actively expanding their team's use of the product. NPS measures a moment in time - not a trend.
More importantly, the correlation between NPS score and churn is weaker than most CS leaders believe. Detractors don't always churn. Promoters do. The score alone doesn't tell you what the relationship is doing over time.
3. Ticket Volume
Low ticket volume is frequently interpreted as high satisfaction. It is often the opposite: it means the customer has given up expecting improvement.
Customers who submit support tickets are invested in the relationship. They believe that raising a problem will result in a resolution. When ticket volume drops suddenly from an active submitter, it's a signal worth investigating - not a green flag.
The Right Approach
Use leading indicators - TTV, adoption breadth, engagement trend - to catch what's building. Use lagging indicators - NPS, CSAT, ticket volume - to confirm what you already know. And treat any metric that measures activity without measuring depth as a starting point for investigation, not a conclusion.
Larry combines all three - monitoring real-time signals, connecting them across dimensions, and surfacing the accounts where the combination tells a story no individual metric would.
Lucas Bennett
Clynto AI
Customer Success practitioner with over 10 years building CS teams from scratch across US, Canada, Singapore as a CSM, team lead, CS leader, and consultant.
Book 20 min with Lucas