Customer Success Leadership
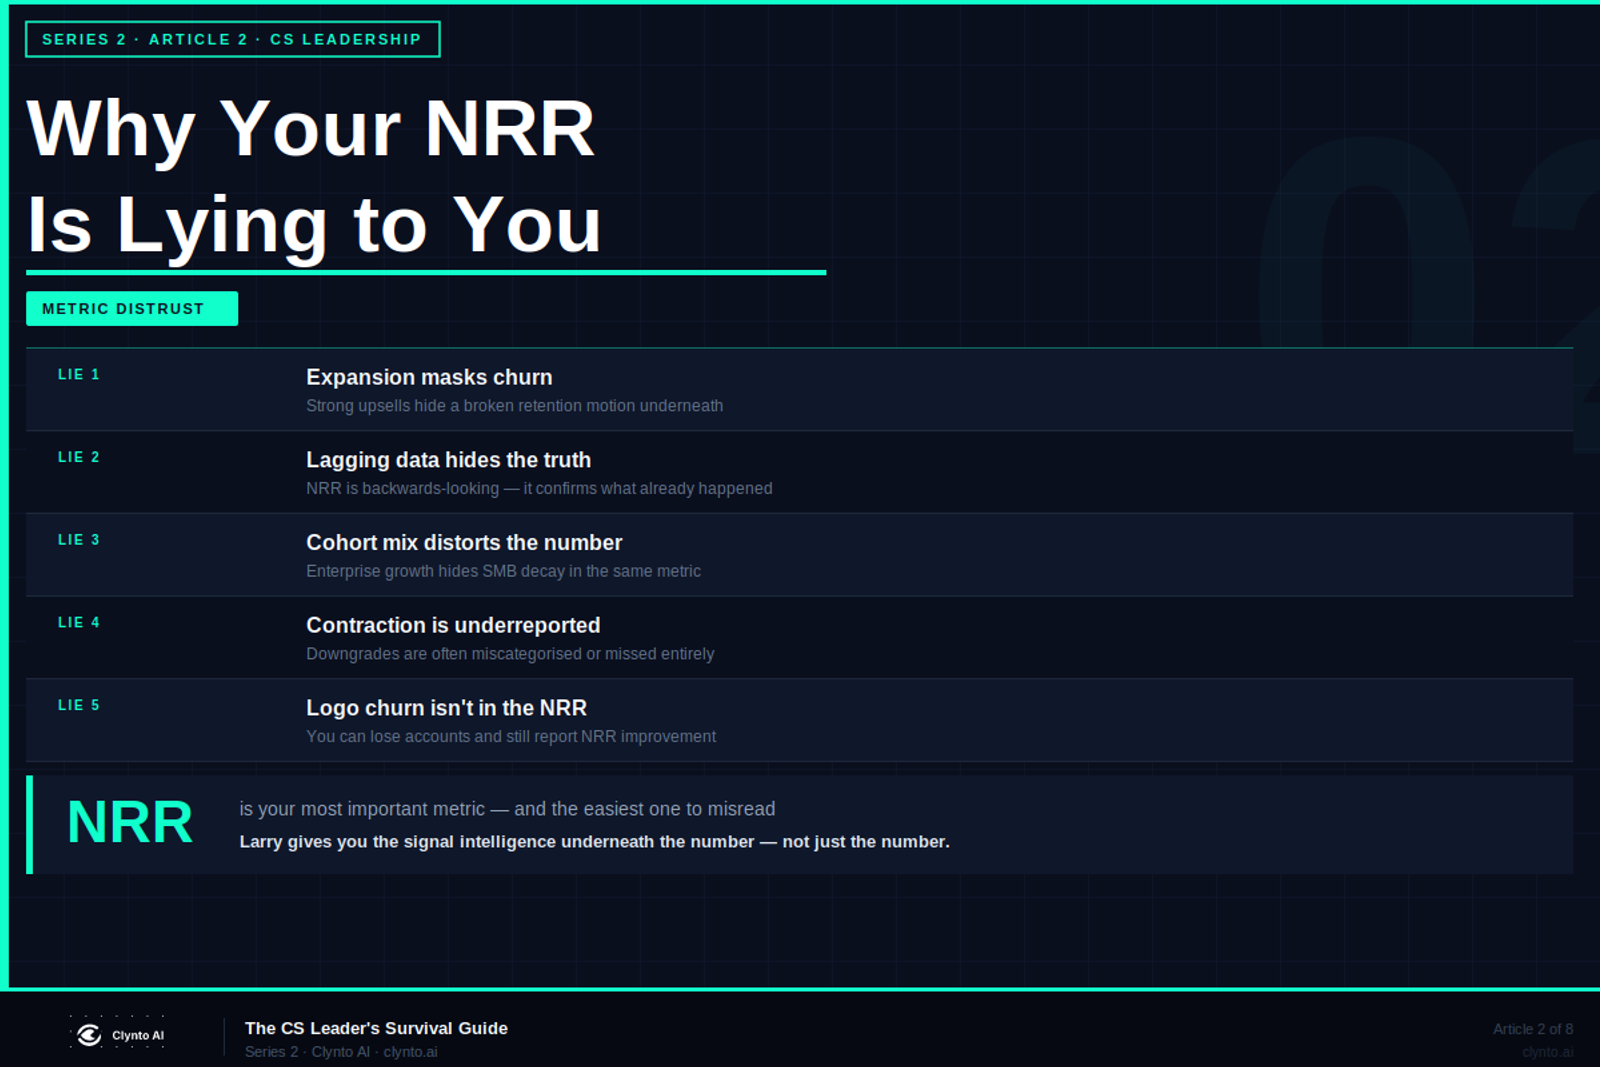
Why Your NRR Is Lying to You
NRR is the metric CS leaders live or die by. It's also the easiest one to misread. Here are the 5 ways your NRR is telling you a story that isn't true - and what to look for instead.

On this page
Why Your NRR Is Lying to You
You report it to the board. You live by it internally. And it may be telling you a story that isn't true.
The Problem With NRR
NRR — Net Revenue Retention — is the metric every CS leader knows they need to improve and every board wants to see growing. It's the single number that captures both your retention and expansion motion in one figure.
It's also one of the most misleading metrics in SaaS when read without understanding what it's averaging over, what it's lagging behind, and what it structurally excludes.
Here are five ways your NRR may be telling you something that isn't actually true.
Lie 1: Expansion Is Masking Churn
A CS team with 10% annual churn and 15% expansion reports NRR of 105%. That sounds healthy. But underneath that number is a retention motion that's failing — masked by an expansion motion that's working.
The problem: expansion motion typically depends on the accounts you're retaining. As the churn compounds, the base of expandable accounts shrinks. NRR can look healthy for 6–12 months after the retention motion has broken, because the expansion is still running on the accounts you haven't lost yet.
When the expansion slows — or when the churned accounts were the ones most likely to expand — the NRR collapse is sudden and hard to explain.
What to look for instead: Separate your gross revenue retention from your NRR. Gross retention below 90% with high NRR is a signal to investigate urgently.
Lie 2: Lagging Data Hides What's Already Happened
NRR is a backwards-looking metric. It tells you what happened over the measurement period — typically the last 12 months. The churns it reflects were decisions made 6–12 months ago. The expansion it captures was signed weeks or months ago.
This means that when you report NRR in Q2, you're looking at the results of decisions your customers made in Q4 of last year. If something has shifted in your customer base in the past 90 days — champion losses, feature adoption plateaus, engagement declines — the NRR hasn't captured it yet.
What to look for instead: Signal intelligence that reads what's happening now — not what happened. Larry monitors current-state signals across your full portfolio rather than waiting for them to show up in the quarterly metric.
Lie 3: Cohort Mix Distorts the Number
If your enterprise segment is growing and your SMB segment is churning, your NRR can look healthy because the enterprise ARR expansion outweighs the SMB ARR loss. But you're losing customer relationships at scale in your SMB segment — a problem that will eventually limit your enterprise pipeline as references dry up and referrals slow.
NRR aggregates across all segments by default. A single number for a business with meaningfully different CS motions at different segments is structurally misleading.
What to look for instead: Segment-level retention analysis. NRR by cohort, by ARR band, by industry — not just total NRR.
Lie 4: Contraction Is Underreported
Subscription downgrades, seat reductions, and tier drops are often miscategorised, inconsistently tracked, or delayed in being recorded in the CRM. This means the contraction component of the NRR formula is often understated — making the overall number look better than it is.
This is particularly common when CS and finance use different systems with different definitions of what constitutes a "downgrade." The discrepancy accumulates quietly until a reconciliation surfaces it.
What to look for instead: A direct integration between your billing system (Stripe) and your NRR calculation — not a manual export process. Clynto AI's Stripe integration pulls this data automatically.
Lie 5: Logo Churn Isn't in the NRR
You can lose 15% of your accounts in a year and still report NRR above 100% if the accounts that churned were small and the accounts that stayed expanded significantly.
This is mathematically correct NRR. It's also a business that's losing customer relationships at scale — eroding its reference base, reducing market visibility, and building a customer base that's increasingly concentrated in large accounts with significant leverage.
What to look for instead: Track logo churn and NRR simultaneously. Never report one without the other.
What to Read Alongside NRR
NRR is a valuable metric. It becomes dangerous when read in isolation. The metrics that complement it and give you the full picture: gross revenue retention (reveals the real retention performance without expansion), logo churn rate (reveals the account relationship trend), and signal-level intelligence across individual accounts (reveals what's building before it shows up in any aggregate metric).
Larry gives you the signal layer underneath the NRR — the individual account movements that will become next quarter's number before they do.
Clynto AI’s Larry gives you the signal intelligence beneath the metric — not just the metric.
[Get the demo → https://clynto.ai/demo]
Lucas Bennett
Clynto AI
Customer Success practitioner with over 10 years building CS teams from scratch across US, Canada, Singapore as a CSM, team lead, CS leader, and consultant.
Book 20 min with Lucas